:quality(70)/cloudfront-us-east-1.images.arcpublishing.com/cmg/WW5AJL3ARQUGDQMAQUNSFX4CLE.jpg)
Jacksonville, Fl. — The “Buresh Bottom Line”: Always be prepared!.....First Alert Hurricane Survival Guide... City of Jacksonville Preparedness Guide... Georgia Hurricane Guide.
STAY INFORMED: Get the * FREE * First Alert Weather app
FREE NEWS UPDATES, ALERTS: Action News Jax app for Apple | For Android
WATCH “The Ins & Outs of Hurricane Season”
WATCH “Preparing for the Storm”
READ the First Alert Hurricane Center “Survival Guide”
***** ALWAYS CHECK & RE-CHECK THE LATEST FORECAST & UPDATES! *****
NOAA issued their updated annual seasonal tropical cyclone forecast Wed., Aug. 4th (Dr. Klotzbach, CSU will do so Thu., 08/05). No real surprises or changes from the May outlook - an active - in total - season is still expected. The forecast below takes into account the five named storms so far. The upshot is if the forecast is accurate, we have some very busy weeks/months ahead with 10-16 names storms, 6-9 of which could be hurricanes, 3-5 at Cat. 3/4/5 strength. The forecast is predicated on near to above avg. sea surface temps., yet another developing La Nina (cooling of the equatorial Pacific), overall low shear over the Atlantic Basin & an active African monsoon (clusters of t’storms, areas of low pressure that then move westward off of Africa over the Atlantic potentially becoming tropical cyclones).

For right now... things remain pretty quiet over the Atlantic Basin. Plenty of Saharan dust covers the Central & Eastern Atlantic but often sometimes this just delays the development of waves vs. totally shutting down the basin. Still.... there are a couple of areas to watch:
(1) an upper level trough is over the Eastern U.S. & will remain rather persistent through the upcoming weekend while weakening . The trough has helped push a front deep into the Southeast U.S. that’s now stationary. Weak low pressure areas along the front will move east/northeast producing clusters of t’storms. If any of the t’storm complexes can become sustained near the Gulf/East Coast or while moving over the Western Atlantic, some tropical development is at least possible though none is indicated at this time.
(2) the Eastern Atlantic as tropical waves move west off of Africa. Long range forecast models have been occasionally showing tropical systems developing over the Eastern Atlantic while moving west but continue to lack much consistency. Certainly something to keep an eye on, especially considering we’re getting to that time of the year when we start to see long track tropical systems.
Overall - Law of averages (climatology) says expect more active weeks & months ahead. The map below shows the origins in August of tropical systems across the Atlantic, Caribbean & Gulf of Mexico followed by the percent of tropical formation by month:


We’re now within 5 weeks of the peak of the hurricane season (Sept. 10), so just from a climatological point, we should see an uptick in Atlantic activity. But there are also other indications that things are about to become more active with the MJO perhaps the best measure. Using the Madden-Julian Oscillation is not perfect & timing an “uptick” is not usually right on but here’s the deal:
An active MJO can lead to more tropical systems. The map below shows the Velocity Potential Anomalies. In simplest terms the brown lines represent sinking air & therefore less convection & a generally more hostile environment for tropical cyclones. The green lines - over much of the Pacific - are indicative of rising air that leads to more convection & is generally more favorable for tropical cyclones. The rising air should spread eastward the rest of this month signaling a more active period of tropical systems over the Atlantic Basin - roughly from the 10th of Aug. through at least the end of the month & perhaps into early Sept. (followed by another active period several weeks later).
We are seeing the effects of the MJO over the Eastern Pacific:

Sea surface temps. across the Atlantic are now near to above avg. across much of the basin (2nd image below) & - even more importantly - deep oceanic heat content is becoming impressive & the “equivalent oceanic heat content” - namely depth averaged temperature in the upper 300 m (~984 feet) - is even more impressive all the way from Africa to the Gulf of Mexico. Such an ocean water temp. pattern is conducive to long track deep tropical Atlantic tropical cyclones & can lead to a more favored regime for rapid intensification cycles. From an AMS research paper in ‘08 Mainelli, DeMaria, Shay, Goni: “Results show that for a large sample of Atlantic storms, the OHC variations have a small but positive impact on the intensity forecasts. However, for intense storms, the effect of the OHC is much more significant, suggestive of its importance on rapid intensification. The OHC input improved the average intensity errors of the SHIPS forecasts by up to 5% for all cases from the category 5 storms, and up to 20% for individual storms, with the maximum improvement for the 72–96-h forecasts. The statistical results obtained indicate that the OHC only becomes important when it has values much larger than that required to support a tropical cyclone.” More recent research continues to indicate similar correlations.


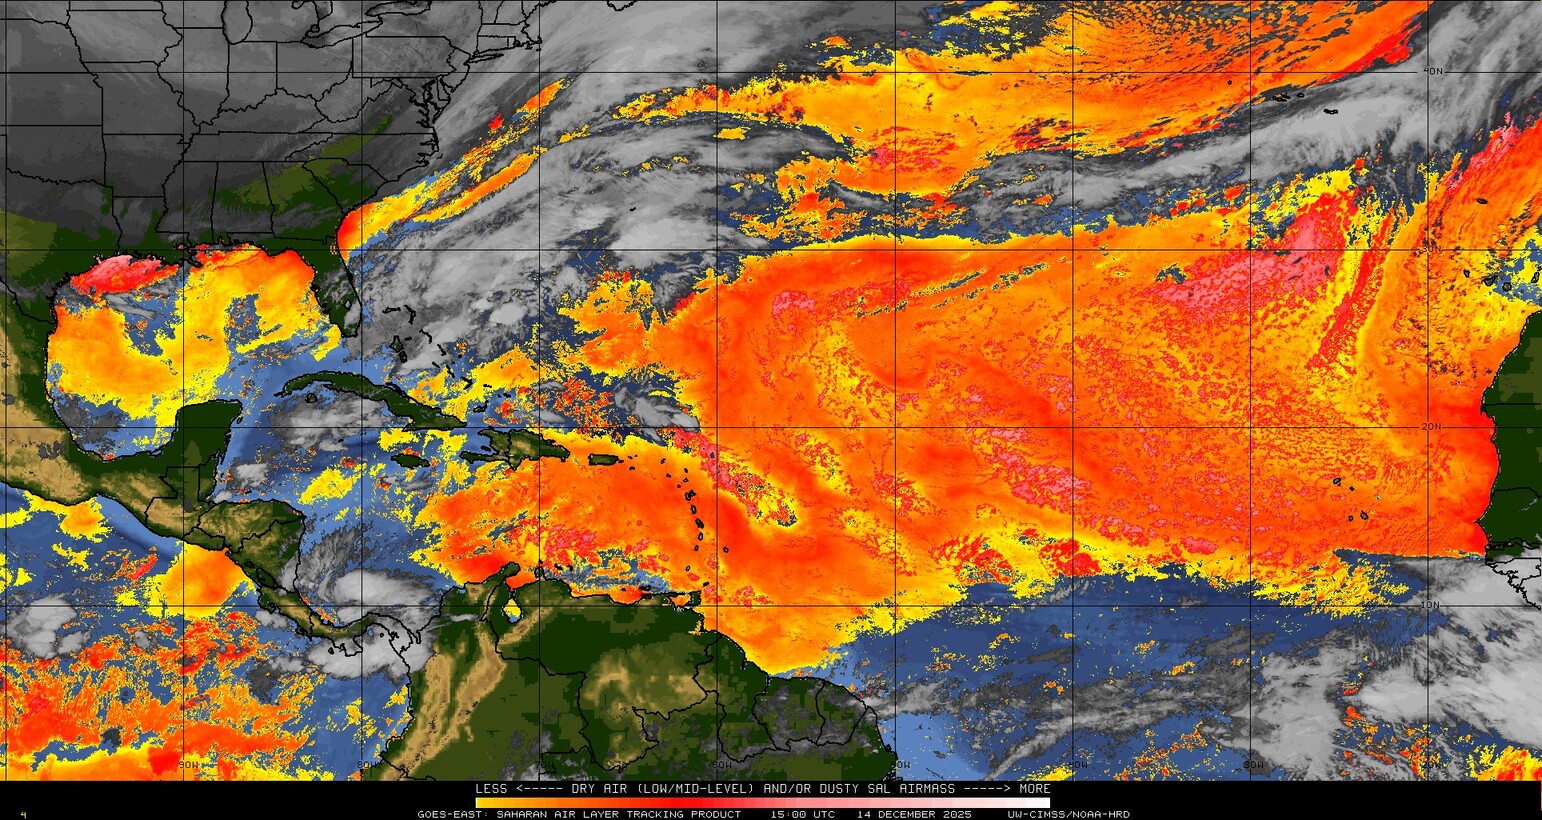
Saharan dust. Dry air - yellow/orange/red/pink - is extensive over the Caribbean & Central & Eastern Atlantic. Such widespread dust is common earlier in the hurricane season & is indicative of dry air that can impede the development of tropical cyclones. However, sometimes “wanna’ be” waves will just wait until they get to the other side of the plume then try to develop if everything else happens to be favorable.
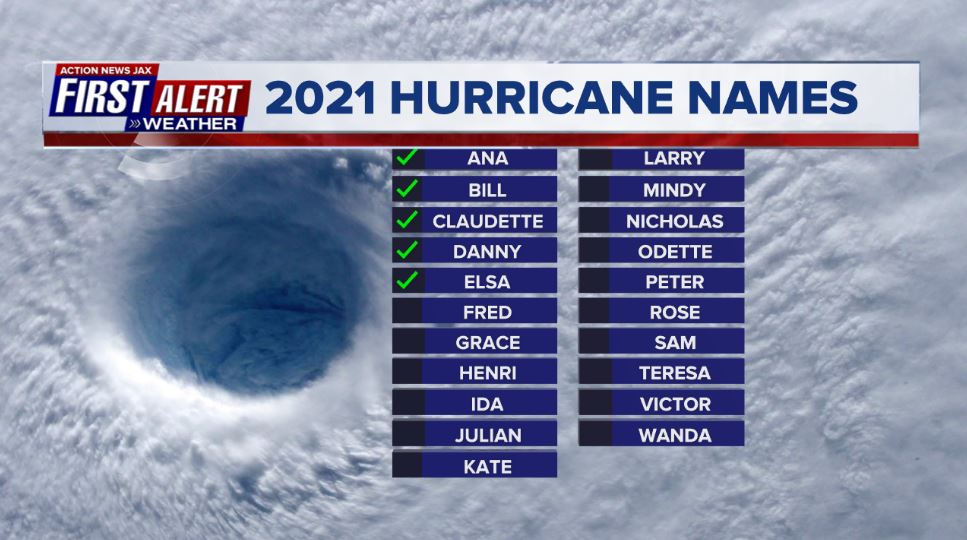
2021 names..... “Fred” is the next name on the Atlantic list (names are picked at random by the World Meteorological Organization... repeat every 6 years... historic storms are retired (Florence & Michael in ’18... Dorian in ’19 & Laura, Eta & Iota in ‘20). Last year - 2020 - had a record 30 named storms. The WMO decided beginning in 2021 that the Greek alphabet will be no longer used & instead there will be a supplemental list of names if the first list is exhausted (has only happened twice - 2005 & 2020). More on the history of naming tropical cyclones * here *.

East Atlantic:


Mid & upper level wind shear (enemy of tropical cyclones) analysis (CIMMS). The red lines indicate strong shear:
Water vapor imagery (dark blue indicates dry air):

Deep oceanic heat content continues to increase across the Gulf, Caribbean & deep tropical Atlantic & has become pretty impressive from the Central/NW Caribbean into the Gulf of Mexico:
Sea surface temp. anomalies:

SE U.S. surface map:
Surface analysis centered on the tropical Atlantic:
Surface analysis of the Gulf:
Caribbean:
Atlantic Basin wave forecast for 24, 48 & 72 hours respectively:
The East Pacific is the busy basin as far as global activity is concerned:


West Pacific IR satellite:

A tropical storm &/or typhoon is forecast to develop south & southwest of Japan possibly nearing Tokyo by Sunday as the Olympics come to a close.

Global tropical activity:

Cox Media Group
:quality(70)/cloudfront-us-east-1.images.arcpublishing.com/cmg/HJ3L3HBBJBH6PB5ZFB3SVGFXSU.png)
:quality(70)/cloudfront-us-east-1.images.arcpublishing.com/cmg/4TQDXERT5VGORNZ4NQWXNO5H64.png)
:quality(70)/cloudfront-us-east-1.images.arcpublishing.com/cmg/SKX4RKW645ERTATCLA4V2FVRKQ.png)
:quality(70)/cloudfront-us-east-1.images.arcpublishing.com/cmg/TYVIYUNT7BBHDLGYYWGCJB424E.png)
:quality(70)/cloudfront-us-east-1.images.arcpublishing.com/cmg/WYUHBF3SFRC7HITANNA24VG6DI.jpg)
:quality(70)/cloudfront-us-east-1.images.arcpublishing.com/cmg/V7JDMMD6JJEEHIL6C7OSLV3ABU.png)
:quality(70)/cloudfront-us-east-1.images.arcpublishing.com/cmg/MYSKYCHVSMSVR73SS5AIPYFCA4.jpg)
 Sign Up

